Question:
I am creating a presentation schedule from Microsoft Project and would like to use the Coded Symbols and Bars format. Can I get an example of how that works?
Question:
When importing an MS Project file using the Code Bars and Symbols format, is there a way to have each of the individual task rows within a swim lane show up so that they are on separate rows within the swim lane when you first do the import instead of having to try and individually move each of the tasks to separate rows.
|
Answer:
For complete help, see the Coded Symbols and Bars help topic.
Here are step by step instructions which can be followed.
- Download and save this file: codedsymbolsandbarstemplate.mlq. Be sure to save it as a chart (not a template) in your Milestones version.
- Download and save this file: codedsymbolsandbarsexample.mpp
- In Milestones, choose Connections | Microsoft Project | Create Report from Project.
- Locate the codedsymbolsandbarsexample.mpp file saved in Step 2.
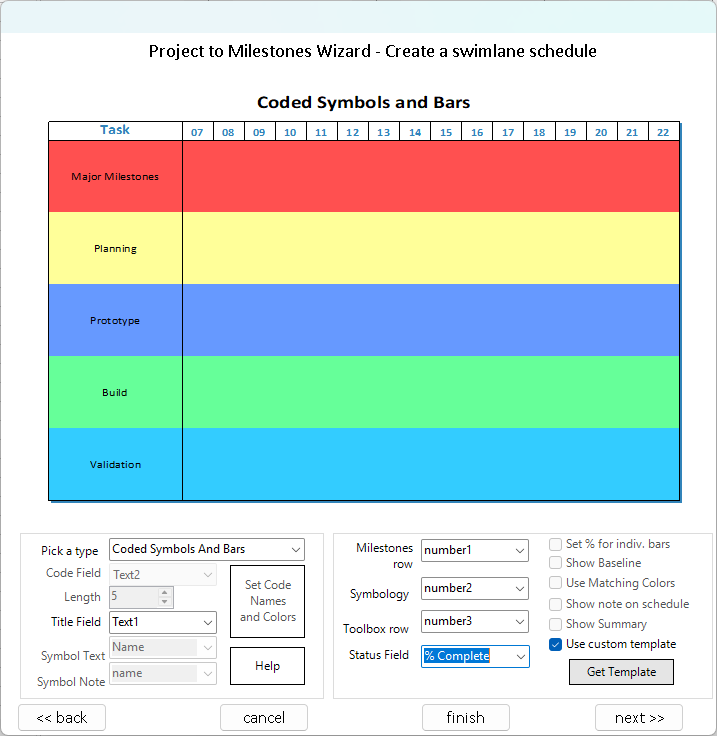
- In the Wizard, choose Make a swimlane chart. Then, Next.
 Use custom template. Use custom template.- Click Get Template and locate the codedsymbolsandbarstemplate file saved in Step 1.
- Make the following choices. Then, press Finish. (Screen may look different in your version.)
Microsoft Project schedule (codedsymbolsandbarsexample.mpp)
The Microsoft Project schedule is coded like this. The 3 columns on the right are Row in Milestones (Number 1), Symbol Type (Number 2) and Toolbox Row (Number 3):

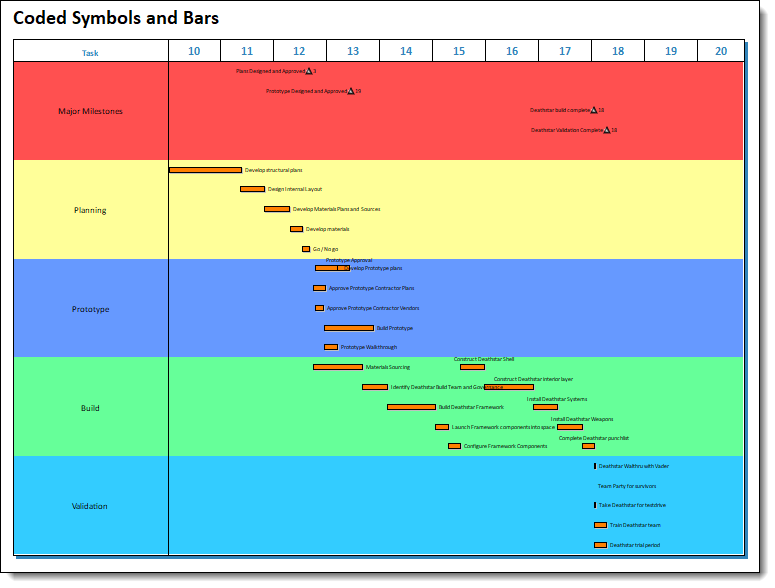
Resulting Schedule
The resulting swimlane schedule should look very similar to this one:
|