Outline and summarize tasks
Outlining is useful for organizing parts of a schedule. It’s best to outline a schedule with enough levels so each task level has a clear, definable item of work that can be identified, budgeted, assigned, and tracked. Summary bars are shown automatically for lower level tasks. Once a schedule is outlined, use the roll-up feature to present different levels of schedule complexity to various audiences.Costs, budgets and other numerical values associated with lower-level tasks can automatically roll-up (sum) to each upper outline level. See: Tutorial Lesson 6 - Outline a schedule
BasicsAdd an outline level SmartColumn
Indent or outdent a task
-or-
Set the indentation amount for outline levels
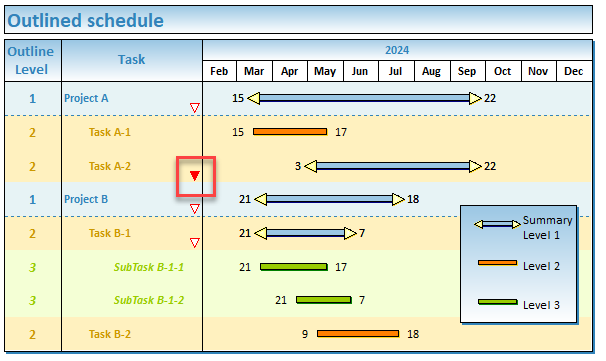
Collapse (roll-up) and expand tasksMilestones Professional schedules can be outlined using an easy to manage indenting capability. Main steps are typically at outline level 1. The steps immediately under the level 1 steps are outline level 2. Up to 20 outline levels are supported. In an outlined schedule, task rows can be expanded (shown) or collapsed (rolled up and hidden) using collapse/expand indicators, the right-click menu, or the filter option. Using the collapse/expand indicators or an option on the right-click menu, roll-up and expand of tasks is easy. Use Collapse/Expand Indicators to hide/show lower level tasks:
Collapse/Expand indicators:The Collapse/Expand icons are only shown on task rows which can be collapsed or expanded. That is, task rows without lower-level detail will not display the collapse/expand icons.
Right-click to collapse/expand lower level tasks:Collapse/expand a single outlined section:
Collapse all tasks to a specified outline level:
Filter tasks to a specified outline level
Shade based on outline levelOutline level shading can help make a schedule more presentable. It's easy to set up and when the automatically apply option is on, the task shading will take effect as the schedule is changed. Customize the task row background shading, column text, horizontal grid lines, and summary bar settings for any of the 20 outline levels. Each outline level can have its own settings. These settings will override the schedule's default settings. |

 To change the color, size and shape of the collapse/expand indicators, go to Tools | Program Options | General. Change the color next to Roll-up triangle color, pick a shape and pick a size.

|
|

Summary row calculations
For Calculation/Indicator SmartColumns, calculations on summary rows can be turned-off. The result is a roll-up of lower-level values.
To not perform calculations on summary rows:
-
Select the Calculation/Indicator SmartColumn.
-
In the Column Type and Format section, click the
 Properties button.
 -
 Do not do calculation on Summary Rows and the values will roll-up (add up) from lower levels to upper levels instead of being calculated.
Override a selected task's summary bar color
This setting overrides the summary bar's fill color for the selected task row. Set the normal and baseline bar colors separately.
-
Click once on the summary row in the column area. This will display the Selection menu.
-
In the Summary Bar Color section, next to Summary Bar Color Override, select a color for the horizontal bar.
-
Next to Baseline Summary Bar Color Override, select a color for the baseline horizontal bar.
Roll-up (collapse) tasks to summary bar
Tasks can be collapsed or expanded easily. One way is to use the roll-up indicator in the column.
Turn on collapse/expand indicators.
Roll-up of lower level symbols and bars
Normally, summary bars display a time span reflecting the first start date and the last end date of the underlying project steps.
It's possible to cause all of the lower level symbols and bars to be displayed on the summary bar.

-
On the toolbar, choose Layout | Other | Summary Bar Settings...
-
Split Summary Bars using Lower Level Symbols/Bars.
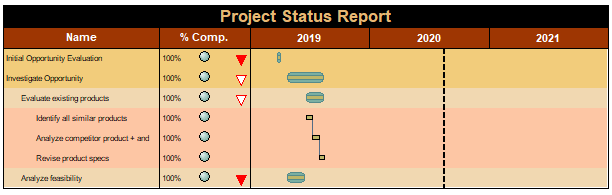
Display a specified symbol on a summary task row
Individual symbols which appear on sub-task rows can be displayed on summary task rows. Choose to display the symbol on all summary levels or on a specified summary level.
In the example below, Task A2's symbol is "rolled-up" to outline level 1.
Display a specific symbol on all summary rows:
- Click
 .
. - Click once on the symbol. This displays the Selection tab.
- In the Summary tab, choose Include this Symbol on all Summary Bar levels.
Display a specific symbol on specific summary level(s):
- Click .
- Click once on the symbol. This displays the Selection tab.
- In the Summary tab, choose Include this Symbol on this Summary Bar level.
- Choose the summary level that "this Summary Bar level" refers to:
 .
. - In the example above, the selected symbol will appear on the parent task row at outline level 1.
Hide the date in summary row date columns
Summary level dates in the Status Date SmartColumn can be hidden. The computed summary status date is the date closest to the place where the summary bar is filled in to show a percent complete. If this date has no meaning, it might be desirable to the summary status date.
-
Choose Layout | Other | Summary Bar Settings...
-
Exclude Computed Status Dates in Summary Rows.
Symbols on summary levels may have dates or symbol text to hide. If summary task rows display single summary bars, use the first method below. If summary task rows display Split Summary Bars using Lower Level Symbols, use the second method below.
Hide dates shown on start and end symbols
-
In the toolbox, find the symbols used for the summary bars.
-
Double-click on one of the symbols.
-
Choose the Text and Date Properties tab.
-
Under Date Placement, choose Hide.
-
Repeat for the other summary bar symbol.
Hide dates and/or text for "Split summary bars" setting:
When lower level symbols and bars are rolled-up to summary levels, it's possible to hide the symbol dates or symbol text on the summary level using this method:
-
Choose Layout | Other | Summary Bar Settings...
-
Hide Dates on Rolled up Symbols.
-
Hide Text on Rolled up Symbols.
This also works for individual symbols which are rolled-up.
Symbols on summary rows move automatically when symbols on lower level task rows move. They are drawn automatically based on the dates in the lower level tasks. Therefore, they cannot be selected or moved independently. Summary row settings can be changed in Layout | Other | Summary Bar Settings. The above is true if When to Draw is on ![]() Always or
Always or ![]() Only When Rolled Up, as Milestones is drawing the summary symbols automatically. If
Only When Rolled Up, as Milestones is drawing the summary symbols automatically. If ![]() Never is chosen then summary bars can be added manually.
Never is chosen then summary bars can be added manually.